How to read the crypto Fear and Greed Index without trading on impulse
What the Alternative.me Fear and Greed Index measures, which factors and weights it uses, what each zone means and how to use it wisely.
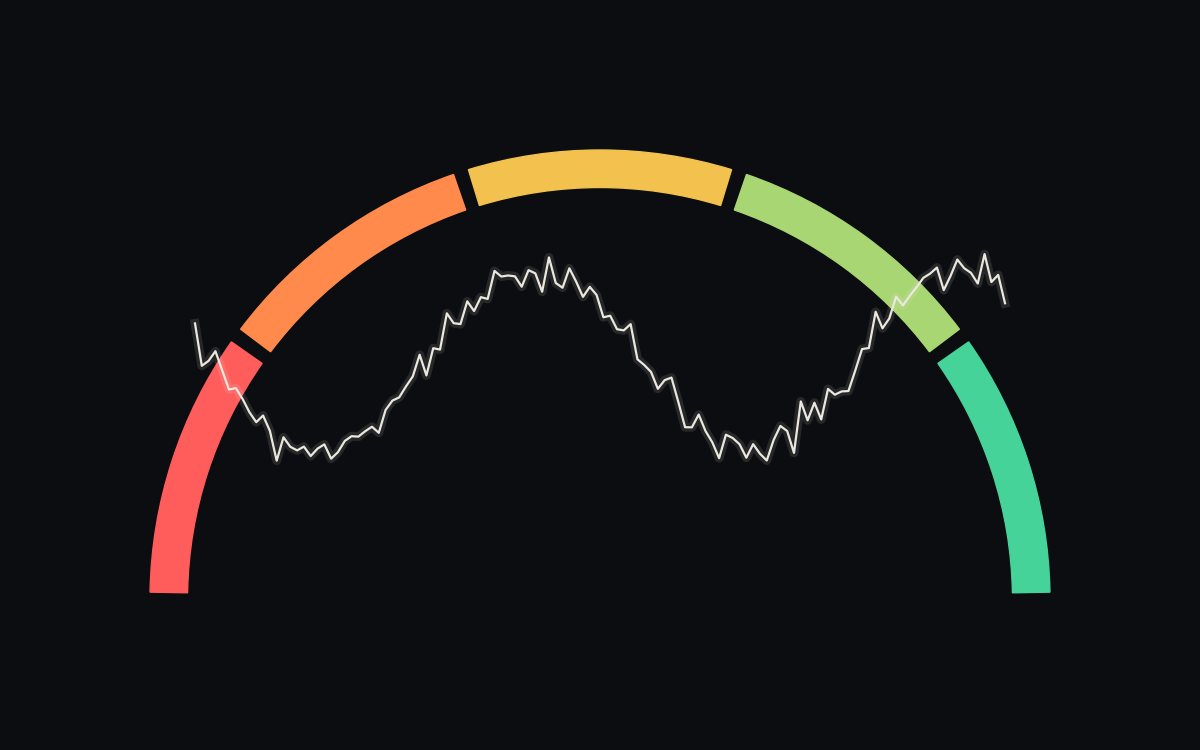
The Alternative.me Crypto Fear & Greed Index is a number from 0 to 100 that sums up market sentiment about Bitcoin: 0 is extreme fear and 100 is extreme greed. It is calculated daily from volatility, volume, social media, dominance and Google Trends. It works as a gauge of the overall mood, not as a buy or sell signal.
What the Fear and Greed Index is
The Crypto Fear & Greed Index is a sentiment indicator: it tries to measure whether the market is scared or euphoric. Alternative.me publishes it, and it runs from 0 to 100. A 0 means extreme fear and a 100 means extreme greed.
The idea behind it is simple. When people are afraid, they tend to panic sell. When they are euphoric, they tend to buy high out of fear of missing out (what crypto calls FOMO). The index puts a number on that mood so you can see it from the outside.
Two important notes before you use it:
- It measures Bitcoin. The index is calculated on Bitcoin. Alternative.me says it plans separate indexes for large altcoins, but the main one does not cover them.
- It updates once a day. It is a daily snapshot, not a real-time indicator.
Which factors it uses and how much each one weighs
According to the methodology published by Alternative.me, the index combines six sources. These are the weights listed on its page:
| Factor | Weight | What it measures |
|---|---|---|
| Volatility | 25% | Bitcoin’s current volatility and maximum drawdowns, compared with the 30-day and 90-day averages |
| Momentum and volume | 25% | Market volume and momentum against the same averages |
| Social media | 15% | Activity and engagement with Bitcoin hashtags on Twitter (X) |
| Surveys | 15% | Weekly user surveys; the page says they are paused |
| Dominance | 10% | Bitcoin’s share of the total crypto market cap |
| Trends | 10% | Google Trends data on Bitcoin-related searches |
Note the detail about surveys: they are listed with their weight, but the page itself says they are on pause. It also says that Reddit analysis is not yet part of the live index. That is why it is worth checking the methodology from time to time: it can change.
Dominance deserves an explanation. When Bitcoin gains dominance, it is often because money is leaving altcoins for something seen as safer. That is read as fear. To understand that data point better, see the guide on what Bitcoin dominance is.
The zones from 0 to 100
Alternative.me does not publish an official table of cutoffs on its main page. But its API labels each daily value with a category, and in recent data the ranges look like this:
Extreme fear (0 to 25)
Panic, heavy selling, negative headlines. Many people sell so they don't lose more.
Risk: selling at the worst moment on impulseFear (26 to 46)
The market is nervous and distrusts any bounce.
Risk: freezing up and not following your planNeutral (47 to 54)
Neither panic nor euphoria. Sentiment is not pushing either way.
Useful for reviewing your plan calmlyGreed (55 to the mid-70s)
Growing optimism, more volume, more talk on social media.
Risk: increasing the size of your buys without thinkingExtreme greed (from the mid-70s)
Euphoria. Everyone is talking about crypto and quick gains.
Risk: buying high out of FOMOTreat these cutoffs as approximate. What matters is the general zone, not whether the index showed 24 or 26.
How to use it (and how not to)
The index is useful for looking at yourself, not for guessing the price. Its best use is to stop impulsive decisions.
How to use it:
- As a mirror. If the index shows extreme greed and you feel like putting everything in right now, you have probably caught the mood. If it shows extreme fear and you want to sell everything, same thing.
- As a reminder of your plan. If you already have set rules (how much you buy, how often, when you take profits), the index helps you stick to them when the mood pushes the other way.
- As context, along with other data. Add it to what you already know about the asset and your financial situation. Don’t use it alone.
How not to use it:
- It is not an automatic signal. Always buying in fear and always selling in greed is not a guaranteed strategy. Extreme fear can last for weeks while the price keeps falling, and greed can hold for a long time in a bull market.
- It is not for short-term trading. It updates once a day and summarizes data from days or weeks.
- It does not measure your token. If you hold memecoins or small altcoins, the Bitcoin index says little about their specific risk.
A practical rule
Before any large buy or sell, check the index and ask yourself: was this decision in my plan before I saw this number? If the answer is no, wait at least a day.
What to do now
If you want the index to really help you, first build a plan that does not depend on your mood that day. A common approach is to buy little by little with fixed amounts and dates: we explain it in what dollar-cost averaging is. And if you are going to trade on an exchange, first review how to secure your account: scams also grow in times of euphoria, as we cover in how to spot crypto scams.
FAQ
Does the Fear and Greed Index work for altcoins?
Not directly. The Alternative.me index is calculated on Bitcoin. Altcoins tend to move with the overall mood, but the index does not measure sentiment for each token.
How often is the Fear and Greed Index updated?
Once a day. That is why it does not reflect what happens minute by minute: an afternoon crash may not show up until the next update.
Does buying in extreme fear always work?
No. Extreme fear can last for weeks and the price can keep falling. The index describes today's mood, it does not predict tomorrow's price.
This guide is educational and is not financial advice. Spotted an error? Request a correction.