The Bitcoin four-year cycle: what it is and how much holds up
What the Bitcoin four-year cycle theory says, its typical phases, the criticism it gets and why the past doesn't guarantee the next cycle.
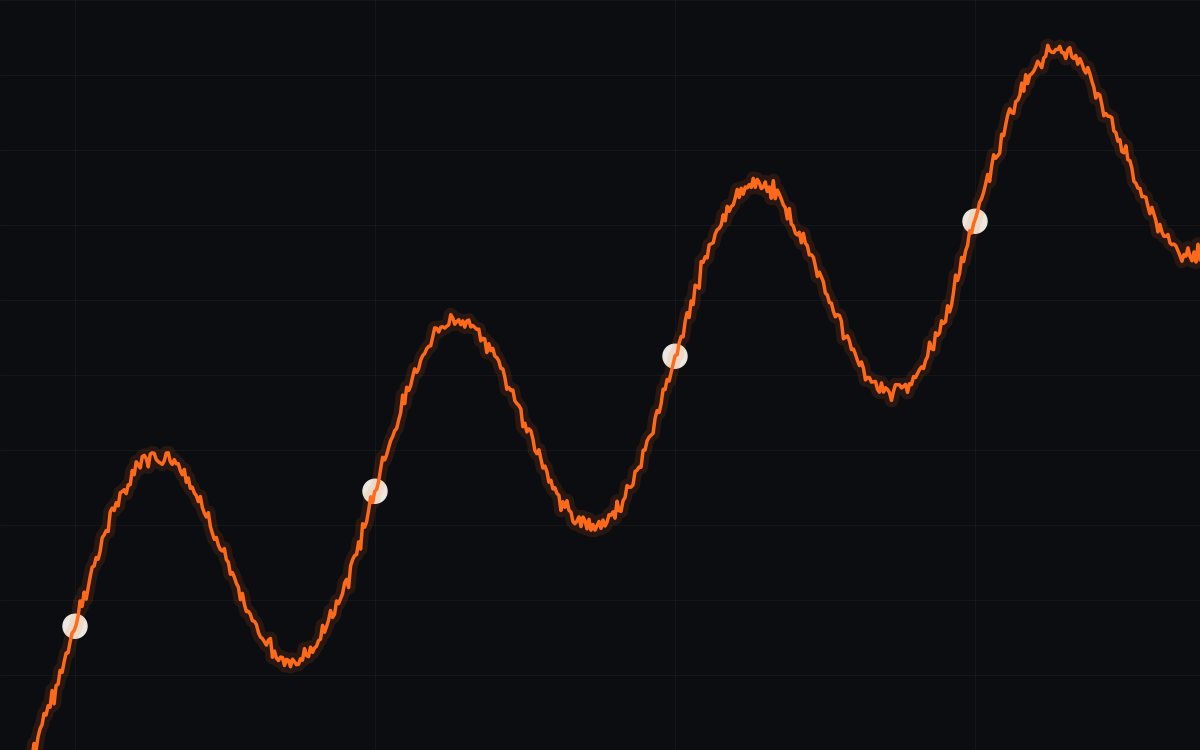
The four-year cycle is the idea that Bitcoin's price repeats a pattern tied to the halving: accumulation, rally, euphoria and decline. Some of that showed up in past cycles, but there are very few cases and other factors were in play. It works as a framework for understanding the market, not for predicting prices.
What the theory says
The four-year cycle holds that Bitcoin’s price moves in waves that last roughly as long as the period between halvings. The halving cuts the issuance of new BTC in half every 210,000 blocks, about four years.
The logic is about supply: after each halving, less BTC enters the market. If demand holds or grows, that pushes the price up. The rally draws attention, new people come in, euphoria shows up and, at some point, the market turns.
Past cycles gave the idea weight. Bitcoin set major highs in late 2013, 2017 and 2021, generally one or two years after a halving. Each one was followed by deep declines, in some cases of more than 70% from the peak.
The typical phases
People who follow the theory usually split the cycle into four stages. They are a simplification: in reality the boundaries are blurry.
Accumulation
After a sharp decline, the price moves sideways for months. There is little public interest and a lot of pessimism.
Usual sign: little media attentionRally
The price starts to recover, often around the halving. Confidence returns, but with doubts still around.
Usual sign: gradual recoveryEuphoria
The price breaks previous highs. New people come in, altcoins rise sharply and promises of easy gains appear.
Usual sign: Bitcoin all over the mediaDecline
The market turns. There is selling, liquidations, bankruptcies of companies in the sector and pessimism that lasts for months.
Usual sign: news of collapsesSome investors cross-check these phases with other indicators, like Bitcoin dominance or the fear and greed index. They help describe the market’s mood, but none of them pinpoints where a phase ends.
The criticism
The theory has firm supporters and equally firm critics. These are the strongest arguments against it.
A very small sample. There have been four halvings since 2012. Four cases are not enough to prove a statistical pattern. With so little data, it is easy to see relationships that are coincidence.
Other factors line up. Past cycles also coincided with changes in interest rates, global liquidity and regulation. It is hard to separate how much the halving explains and how much the context does.
The halving matters less and less. More than 90% of the 21 million has already been issued. Each cut affects a smaller slice of the total supply.
The market has changed. With the arrival of spot Bitcoin ETFs in 2024, buyers came in with a different logic from the retail investors of earlier cycles. For example, in March 2024 Bitcoin set an all-time high before the halving, something that hadn’t happened in previous cycles.
A self-fulfilling prophecy. If many people believe in the cycle and act on it, they can create it. But they can also get ahead of it and change it.
Why the past doesn’t guarantee the future
The cycle describes what happened, not what will happen. Using it to predict prices or exact dates has two problems.
The first is that each cycle was different in length and intensity. The rallies and declines did not repeat in the same shape.
The second is that the market learns. If everyone expects a decline on a certain date, some sell earlier, and the pattern shifts.
Be skeptical of exact dates
If someone shows you a chart with the exact day of the next peak or a price target based on the cycle, take it as an opinion, not as data. Nobody knows the future price.
How to use this framework as a holder
- Use the cycle as context so volatility doesn’t surprise you: sharp declines have happened before.
- Don’t depend on getting the timing right. Many holders prefer to buy on a regular schedule; we explain it in what is dollar-cost averaging.
- Decide ahead of time how much you can hold in BTC without a sharp decline forcing you to sell.
- Use calm periods to sort out what matters: where you store your BTC and how you back up your seed phrase.
FAQ
Does the four-year cycle still work?
Nobody knows. Some believe it still holds and others argue that ETFs and institutional investors coming in are changing it. That is why it is better not to treat it as a rule.
What phase of the cycle are we in?
You can only know for sure in hindsight. In real time, the phases overlap and every analyst marks them differently.
Can I use the cycle to know when to buy or sell?
It is not a reliable tool for that. Many long-term holders prefer strategies that don't depend on guessing the timing, like buying on a regular schedule.
This guide is educational and is not financial advice. Spotted an error? Request a correction.